From Metrics to Meaning: Data-Driven Product Decisions
With many leaders asking their product teams to be more data driven and an ever-growing number of tools on the market that collect data about your products, features, and customers, it’s easy to feel like data is the world’s tallest mountain and you haven’t even left base camp yet. And even if you’re already collecting data, being able to actually use it to generate actionable insights and make decisions might feel equally insurmountable—but it doesn’t have to be.
This year’s Product at Heart lineup featured four themed sessions:
From Metrics to Meaning: Data Driven Product Decisions
Vision to Value: Strategy in Action
True Change: Case Studies in Product Transformation
AI in Practice: Insights for the Road Ahead.
“From Metrics to Meaning: Data-Driven Product Decisions” was designed to help you better define the metrics that matter, gather data effectively, and present your findings in a way that resonates with your target audience.
This themed session featured three 20-minute talks. We heard from:
Marc Roulet, VP, Data & Analytics at sevDesk
Julia Bastian, Product Lead, Research & Innovation at Alasco
Andrey Vinitsky, CEO and Co-founder at Graphy


In this post, we’ll share some highlights from each talk. If you’d like to explore any of the content in more detail, make sure you check out the recordings from each session.
Marc Roulet: Why Metrics Matter – Making Smarter Product Decisions Through Better KPIs
In product management, the road to failure is often paved with the wrong metrics. And Marc Roulet, VP of Data & Analytics at sevDesk, reminded us of the quote that’s often attributed to Peter Drucker, “Without data, you’re just a person with an opinion.”
Just consider Wells Fargo’s sales debacle, where employee bonuses were tied to the number of new accounts opened. This led to 3.5 million fake accounts being opened without customers’ knowledge or approval, and eventually, to $3 billion in fines and a tarnished reputation for the bank.
Snapchat faced a similar problem with their 2017 redesign. Instead of focusing on their users’ needs, they optimized for ad revenue. As a result, the company lost $1.3 billion in market cap, 80% of their audience said they were displeased, and even Kylie Jenner tweeted about how much she hated the changes!
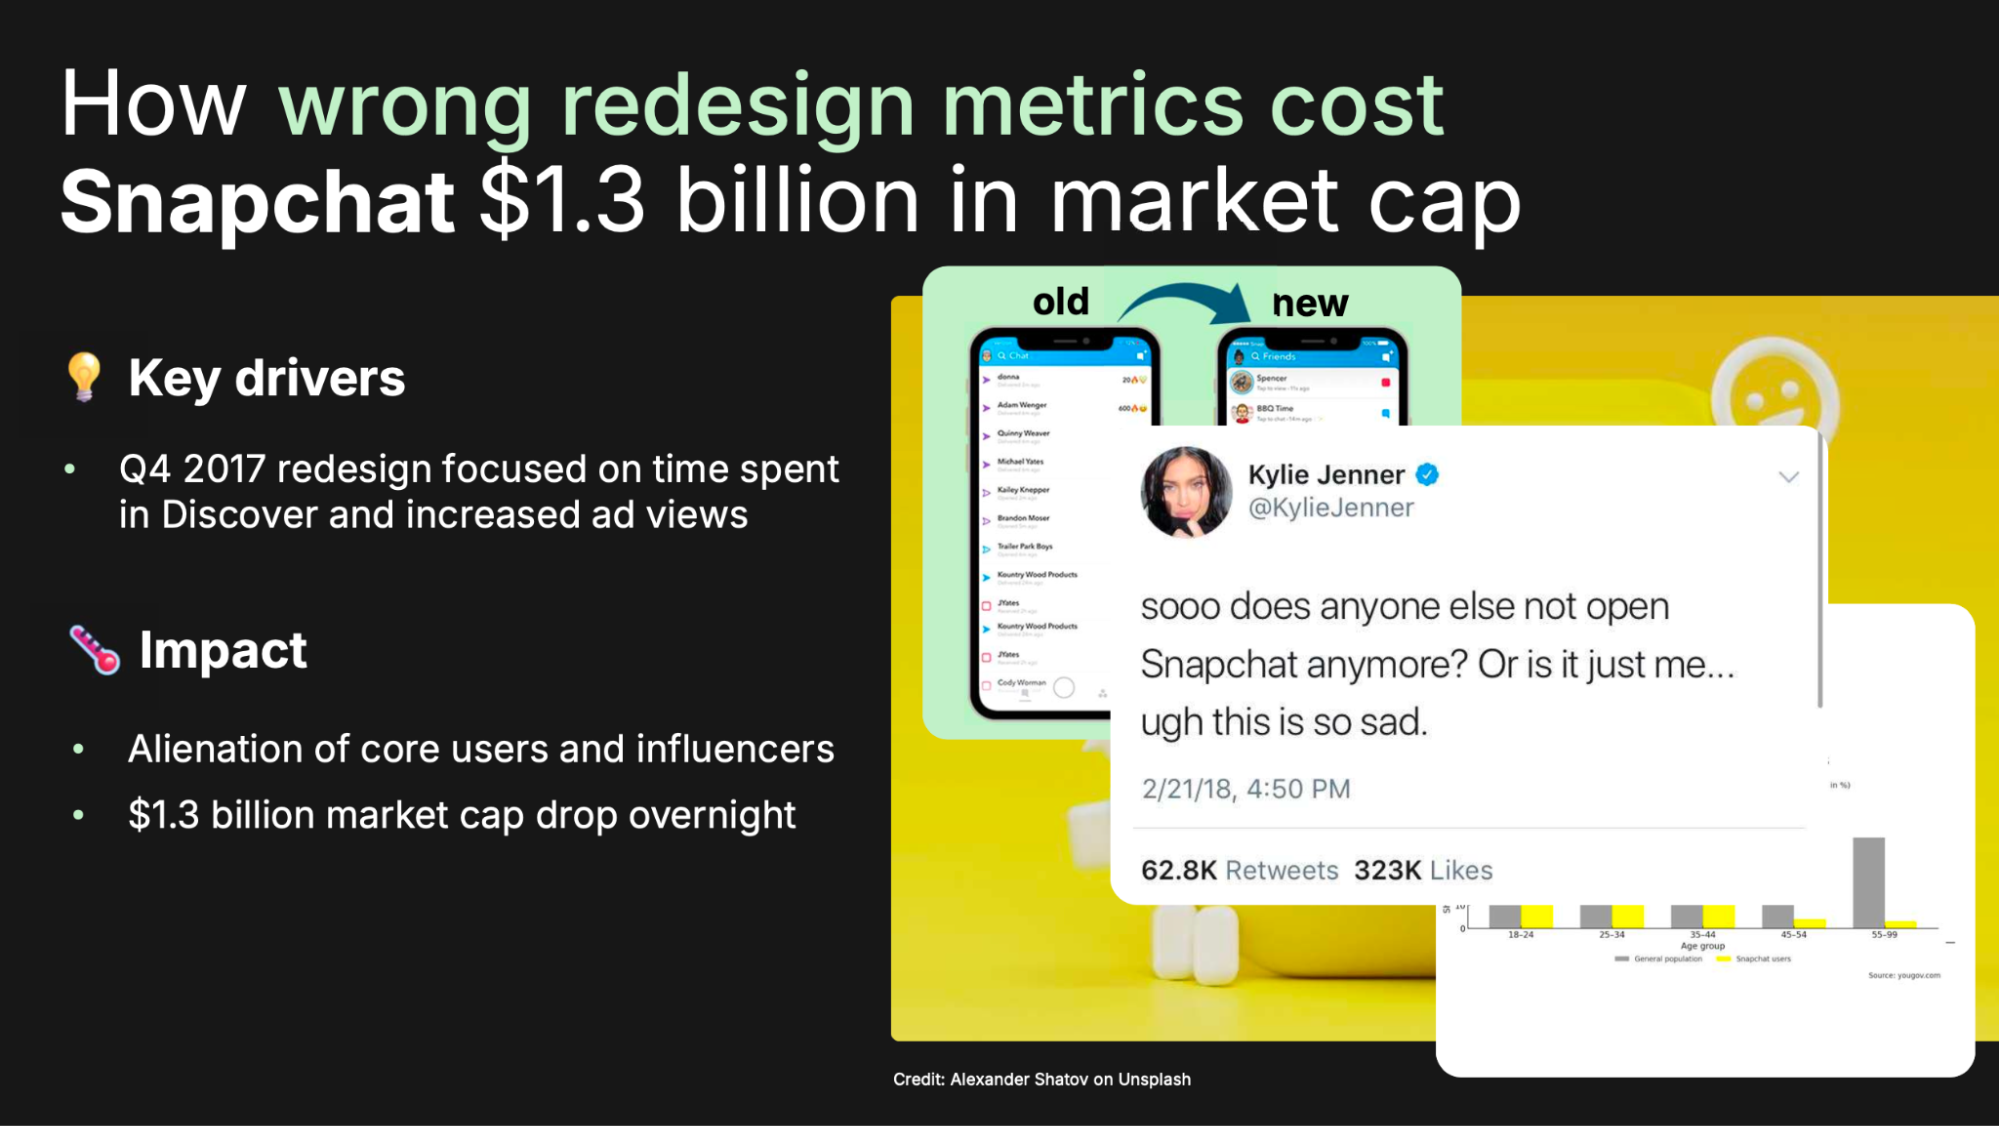
You know something has gone terribly wrong with your redesign when you’ve pissed off Kylie Jenner!
These stories illustrate the importance of focusing on the right metrics—and the dangers of focusing on the wrong ones.
Marc then shared some of the structural weaknesses many product organizations share when it comes to metrics. These include:
A lack of standardization
Unclear definitions
Dashboard sprawl
KPI overload
Next, he offered his framework for a KPI Ladder that can empower product teams to move faster, smarter, and with more confidence.
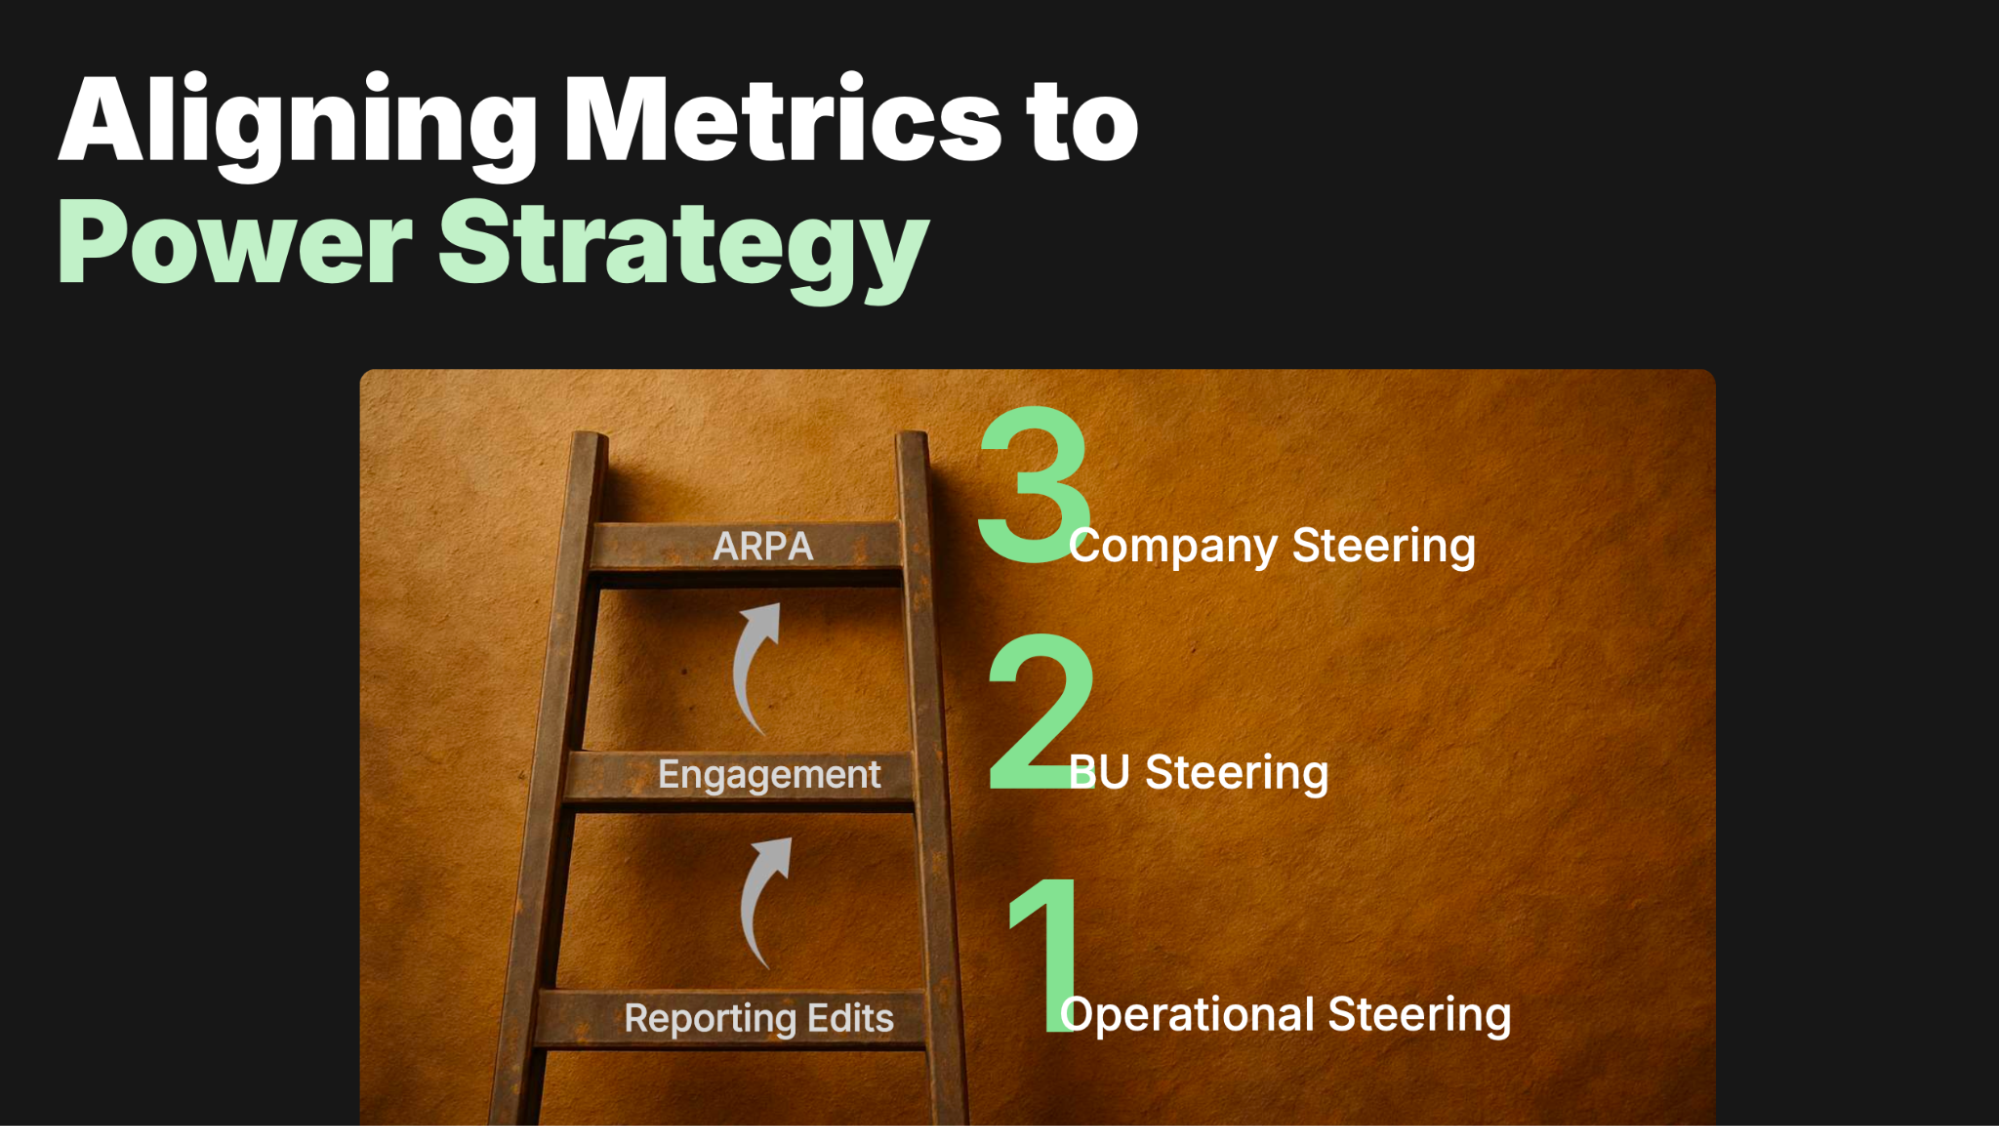
The KPI ladder starts with operational steering, which ladders up to business unit steering, and ultimately company steering.
“If you have clarity on all three levels, you are in great shape to ensure your organization is executing on the right things and reducing inefficiencies,” said Marc.
Be sure to check out the full recording to learn more about how to set up your own KPI ladder and avoid the trap of optimizing for the wrong KPIs.
Julia Bastian: From Lagging Metrics to Leading Decisions: How B2B Product Teams Can Lead with Qualitative Data
In B2B companies, sales often drives product decisions—not because it’s the best path, but because product teams lack the data to challenge it and steer confidently themselves.

When sales dominates decision-making, it leads to complex roadmap processes and many other issues for product teams.
In her themed session, Julia Bastian, Product Lead, Research & Innovation at Alasco, said that the sales-driven approach often turns product organizations into feature factories with degraded user experience and product inconsistency, mounting technical debt, and many other issues.
Part of the problem is that unlike in B2C contexts, B2B data is often slow, sparse, and arrives too late to drive real-time learning. As a result, product managers feel stuck. They’re aware that the current approach isn’t delivering impact, but unsure how to change a system that keeps them reactive.
Julia’s talk offered a call to action for product teams who are ready to take the lead. She emphasized the role of qualitative data from customers and users to help you build your organization’s gut feeling and to create leading metrics that are connected to your desired outcome.
The techniques Julia recommended included:
Guide with signals, review impact
Build up continuous insight management
Proactively drive (early discovery)
Build organizational product sense

Leading metrics and lagging metrics are not the same—make sure you know how to tell the difference and when to use each one.
Julia highlighted the difference between leading and lagging indicators, sharing when to use each type of metric. For example, leading metrics need to connect to your desired outcome and should help steer your actions, while lagging metrics allow you to review your long-term success.
Watch the full recording to take a deeper dive into Julia’s game plan for leading with qualitative data in a B2B context!
Andrey Vinitsky: Babe, Are You OK? You’ve Barely Touched The Dashboard You Claimed Was Mission Critical.
Companies spend millions on their data stack. They collect data, model it, analyze it, visualize it. But most of it ends up in dashboards nobody looks at. The problem isn’t the tools or the data. It’s the last mile.
Andrey Vinitsky, CEO and co-founder at Graphy, broke down this concept of “the last mile” in his themed session, explaining it’s the part where someone actually understands the numbers and takes action.

The Last Mile is the gap between analytical output and your team’s ability to make decisions.
“The value of a dashboard or report is measured by useful actions it prompts,” said Andrey. Unfortunately, most dashboards and reports lead to no action at all.
He explained that it often comes down to the curse of knowledge—things tend to be much easier and simpler in our own heads when we’re experts on a subject, but that doesn’t mean it’s easy for others to draw the same conclusions.
Andrey highlighted the difference between bad graphs (they have too much clutter), good graphs (they cut the clutter), and great graphs (they not only cut the clutter, but they also add insights).

Consider the difference between these two graphs. The one on the left just provides you with data, while the one on the right also offers an insight and a conclusion. Which one is more meaningful to you?
Finally, he shared a few tips for developing a data story—making sure you explain the insights from your data to your specific audience.
Check out the recording for more of Andrey’s advice and actionable ideas on how to improve your data storytelling.
Want to dive deeper into any of the topics from Product at Heart? Make sure you check out the other posts on our blog and dig into the video archive!